
Autonomous Vehicles · Data
First it was the enthusiasts. Now it's your neighbor.
Robotaxi ridership has grown tenfold in two years. Mapping that growth onto the classic diffusion of innovations curve shows exactly who is riding now, who's next, and why the playbook that won the first million riders won't win the next ten million.
In May 2024, Waymo was giving about 50,000 paid rides a week. By early 2026 it passed 500,000 weekly rides, with more than ten U.S. markets live and a stated target of a million rides per week by the end of the year.
A tenfold jump in two years! But the change that's more interesting than how many people are riding… is who.
Diffusion of innovations research has shown for decades that new technologies don't spread through a population evenly. They move through distinct segments, in a reliable order: innovators first (about 2.5% of the population), then early adopters (the next 13.5%), then the early majority (34%), the late majority (34%), and finally the skeptics who adopt last, if at all. Each group has a different personality, different information sources, and different reasons to say yes. That's why it's best to not think of adoption as one persuasion problem where you try to persuade "people" (a monolith) to adopt. Instead, it's a relay race where the baton changes hands between segments as behavior diffuses through the population.
The first riders looked exactly like the textbook said they would
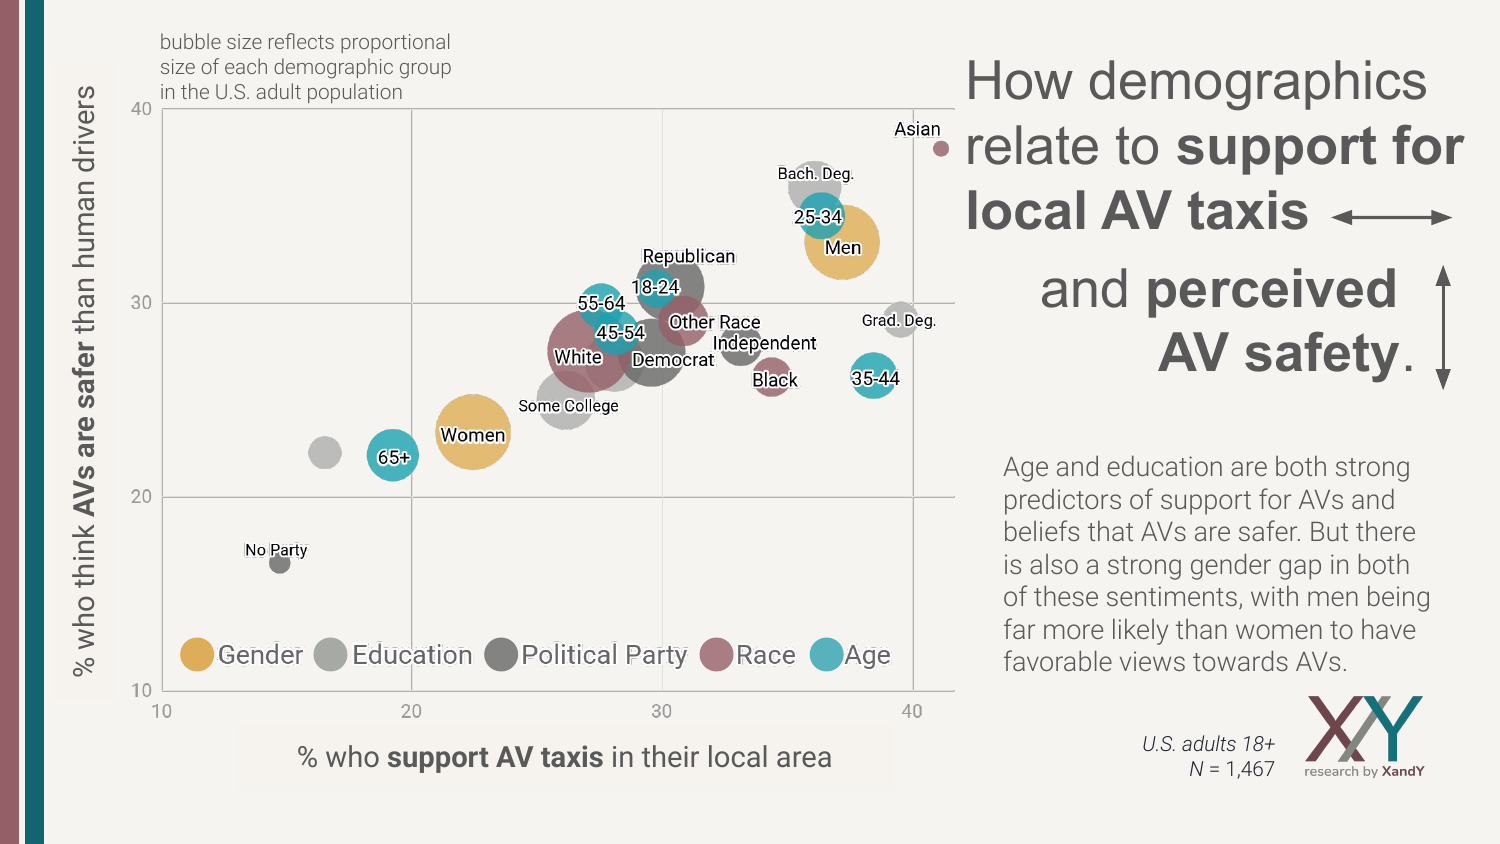
Our 2025 national polling found the early AV persona was exactly the stereotype you'd expect: younger, more educated, more male, more urban, already comfortable with adjacent technology. Support for local robotaxi service and belief in AV safety moved together across every demographic group we measured, and the groups highest on both—men, adults 25 to 34, college graduates—are a census-perfect portrait of the classic innovator and early adopter. External data also show that early adoption of other tech is related, as electric vehicle owners report far more comfort with AVs than the general public.
Nationally, that's still roughly where things stand. In our 2025 poll, 21% of American adults said they'd be willing to ride a fully autonomous vehicle regularly today, and another 15% put themselves within three years. More than a third said never.
In the operating markets, the persona has already changed
But things are changing fast, and that change is fairly recent. Here in 2025 in the cities where robotaxis actually operate, the rider base has visibly outgrown the pure innovator-enthusiast segment. San Francisco is the clearest case. Support for driverless robotaxis there rose from 44% in 2023 to 67% in mid-2025, with net favorability swinging from minus 7 to plus 38.
National consumer data shows the same exposure effect: 52% of people living inside Waymo service areas say robotaxis should be legal, compared to only 34% outside them. And the qualitative signal corroborates this—in operating markets like SF and LA the robotaxi is no longer a novelty to photograph but a familiar background detail that blends into the trafficscape. That's not how we'd describe something still in the "Innovator" stage. In those cities, we're very clearly now into adoption by the early majority: pragmatists who adopt once something is proven, normal, and useful.
The national picture, then, is really two curves running at different speeds. Where AVs operate, adoption is pushing into early-majority territory. Where they don't, opinion looks almost exactly like our 2025 data: half of Americans didn't even know AV taxis were already running in U.S. cities, and awareness was one of the strongest correlates of support in our entire survey.
Why this changes the playbook
The early majority does not buy what innovators buy. While innovators adopt because something is new, the pragmatists adopt because it's proven. The early majority respond to visible evidence, trusted institutions, and social norms (seeing people like themselves ride, hearing from messengers they already trust). Our own polling shows traditional automakers hold the most public trust to develop safe AVs (48%), while the rideshare brands most visible in actual deployments rank near the bottom (31%).
The next few years of AV adoption will be decided by whether the industry can make that handoff—from selling novelty to the few, to proving normalcy to the many. The riders have already started to change. The message needs to change with them.
Sources & notes. XandY Poll national survey, April 2025, U.S. adults (18+), N = 1,467, quota-sampled and census-weighted, MoE ±3 points — read the full report. Rogers, E. M. (2003), Diffusion of Innovations (5th ed.). Waymo ridership and expansion: TechCrunch, Waymo. San Francisco trend: The San Francisco Standard. In-market vs. out-of-market gap: EV Intelligence via InsideEVs. Share of Americans who have ridden a driverless car: Pew Research Center, February 2026.